Datasets sources

This 4th release of ReMap (2022) we have manually curated, annotated and retained 795 quality controlled ChIP-seq/DAP-seq experiments from the GEO data wharehouse. Those ChIP-seq (n=179 TRs, n=286 Histones), DAP-seq (n=330) datasets have been mapped to the TAIR10 assembly. Here we define a “dataset” as a ChIP-seq experiment in a given series (e.g. GSE94486), for a given target (e.g. ARR1), in a particular biological condition (i.e. ecotype, tissue type, experimental conditions ; e.g. Col-0_seedling_3d-6BA-4h). Datasets were labeled by concatenating these three pieces of information such as GSE94486.NR2C2.Col-0_seedling_3d-6BA-4h.

Statistics

T. Regulators ChIP-seq Histones ChIP-seq DAP-seq
Datasets (QC pass) 364 286 330
Targets 131 33 292
Peaks 4,072,007 4,528,203 771,023

423

Thaliana Transcriptional Regulators

Browse Thaliana datasets

4,843,030

Transcriptional factors regions

Download Thaliana data

33

Thaliana Histone modifications

Browse a given dataset

4,528,203

Histone binding regions

Download Thaliana data

Integration of ChIP-seq and DAP-seq data

After consistent peak calling across datasets, we identified peaks bound by transcriptionnal regulators from ChIP-seq and DAP-seq data (GSE60141), giving a regulatory atlas of 4.8 million peaks. These numbers may include overlapping sites for identical TR targets which were studied in various conditions. To address this we merged overlapping TRs binding regions for similar TRs obtaining a catalogue of 3.2 million non-redundant binding sites.

Finally in 2020 we also applied our pipeline to available histone ChIP-seq data and identifed 4.5 million broad and gapped peaks.

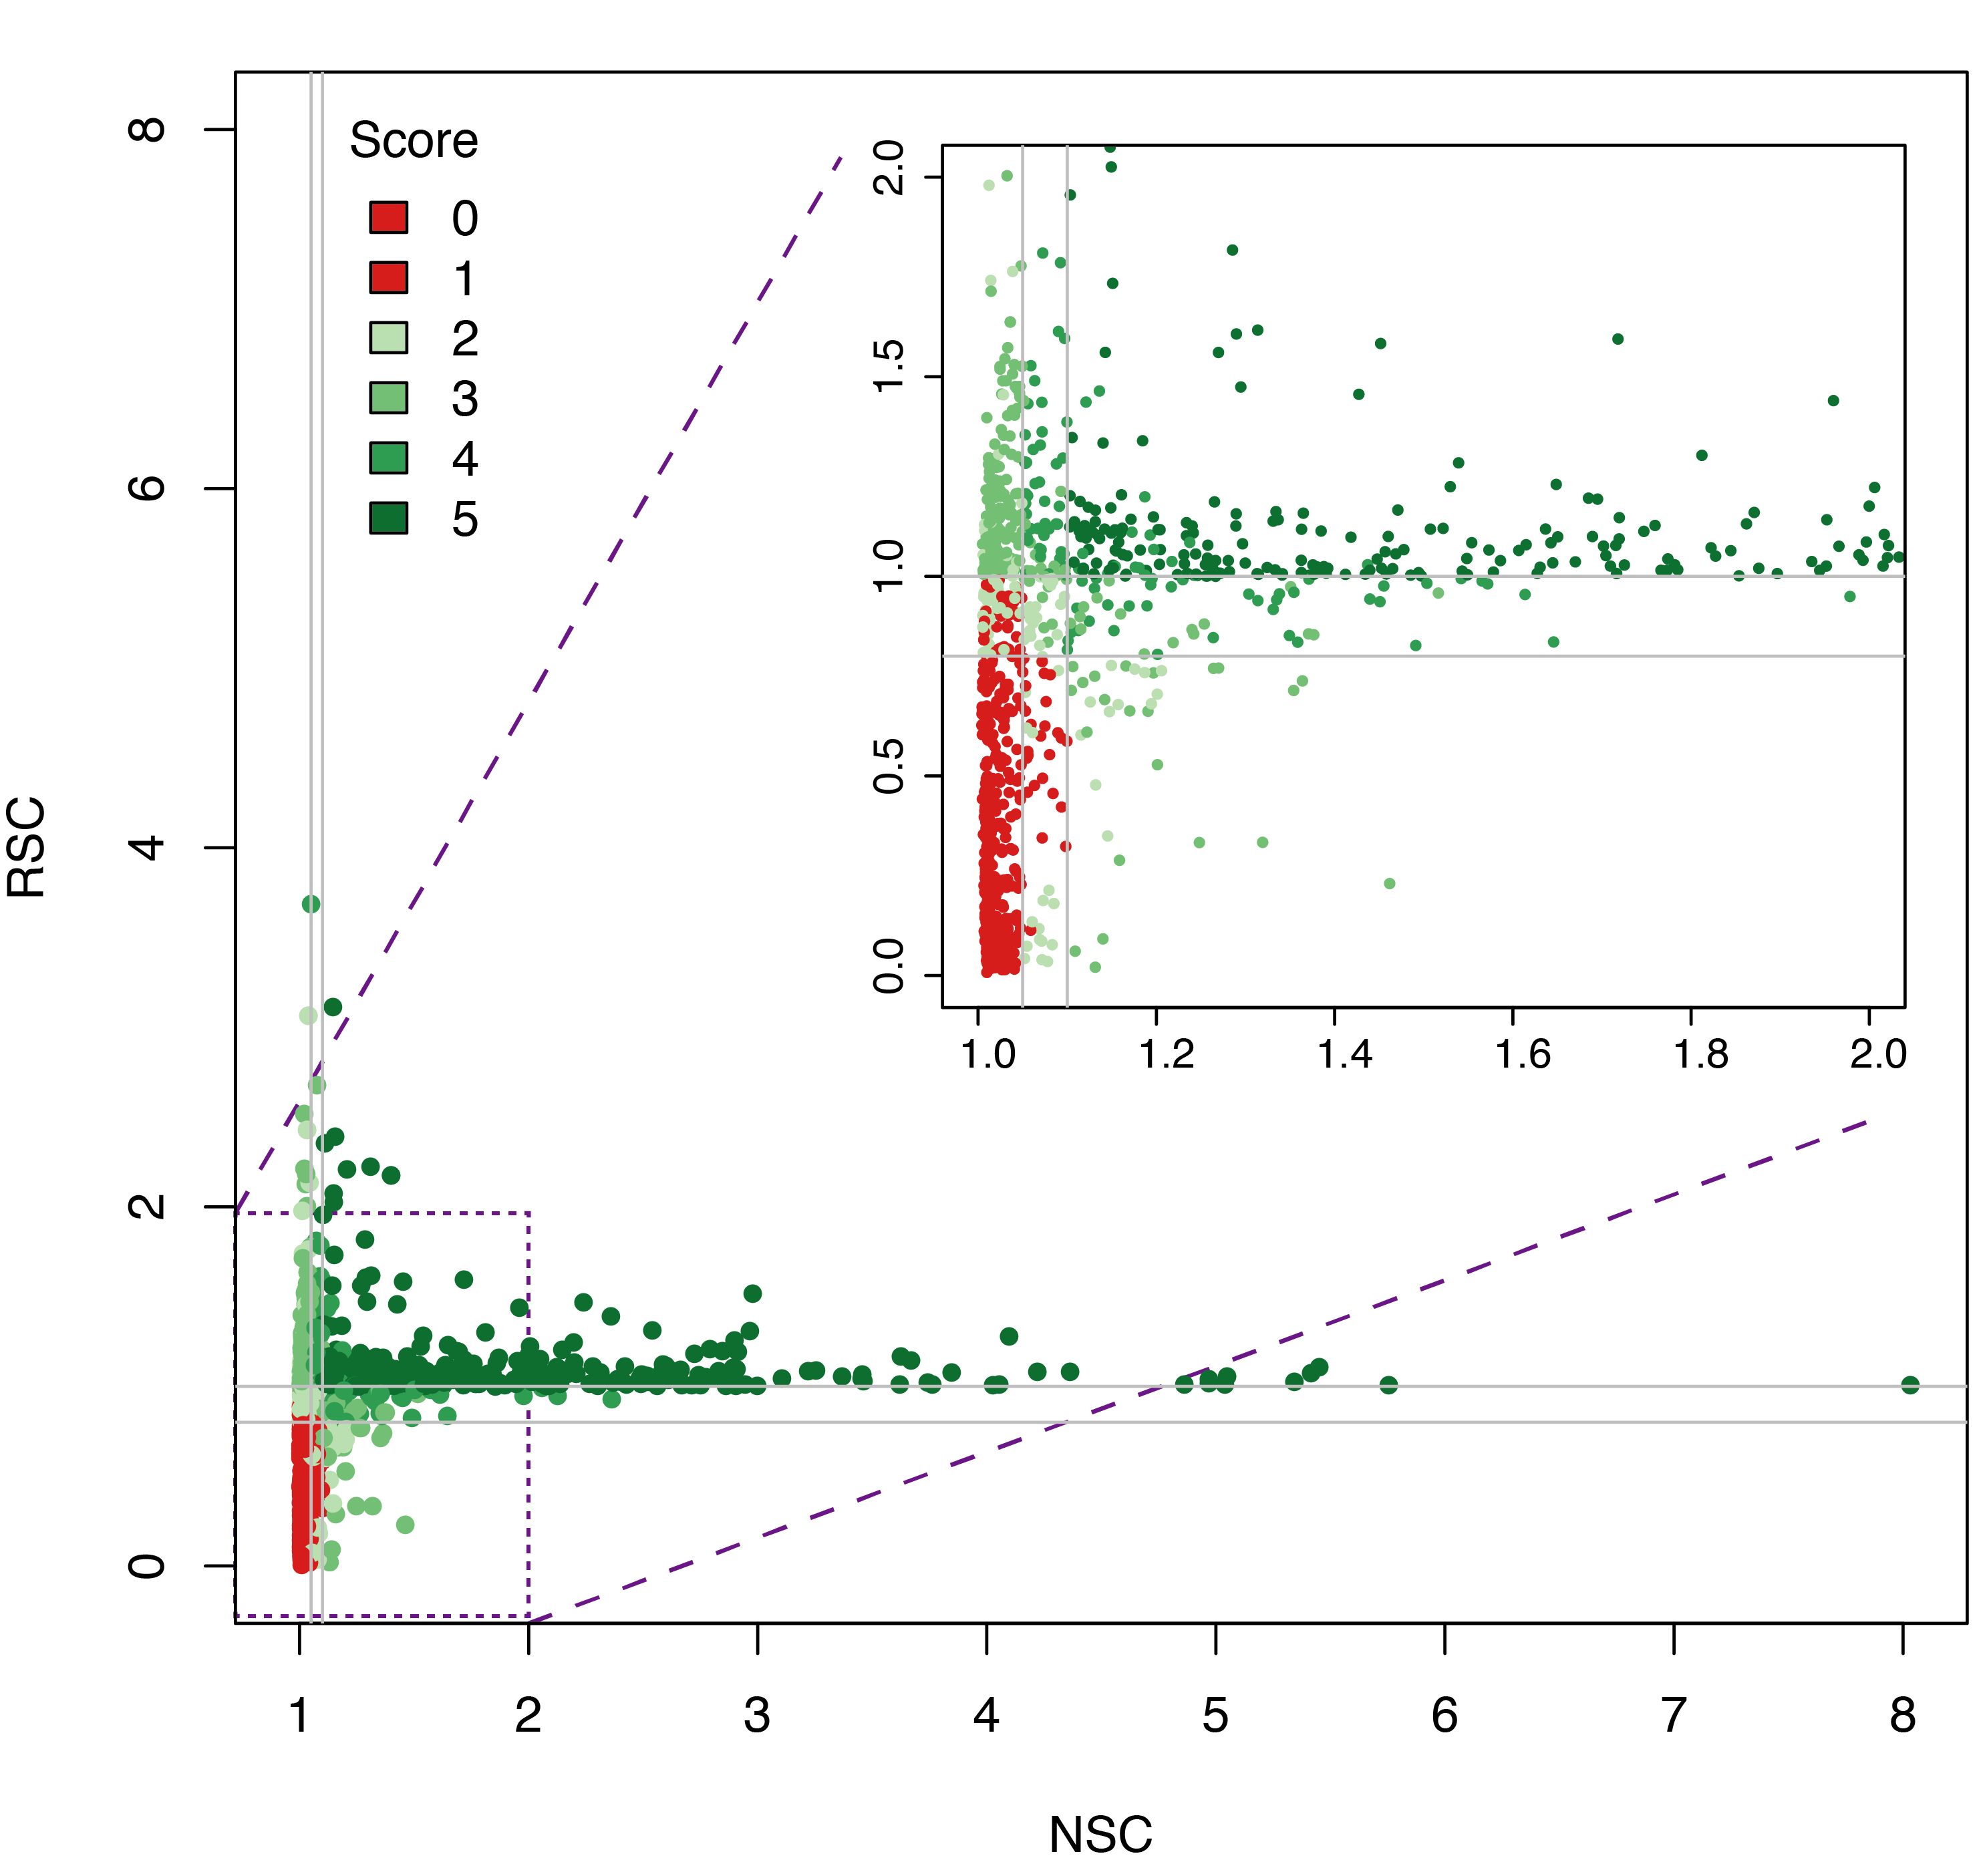
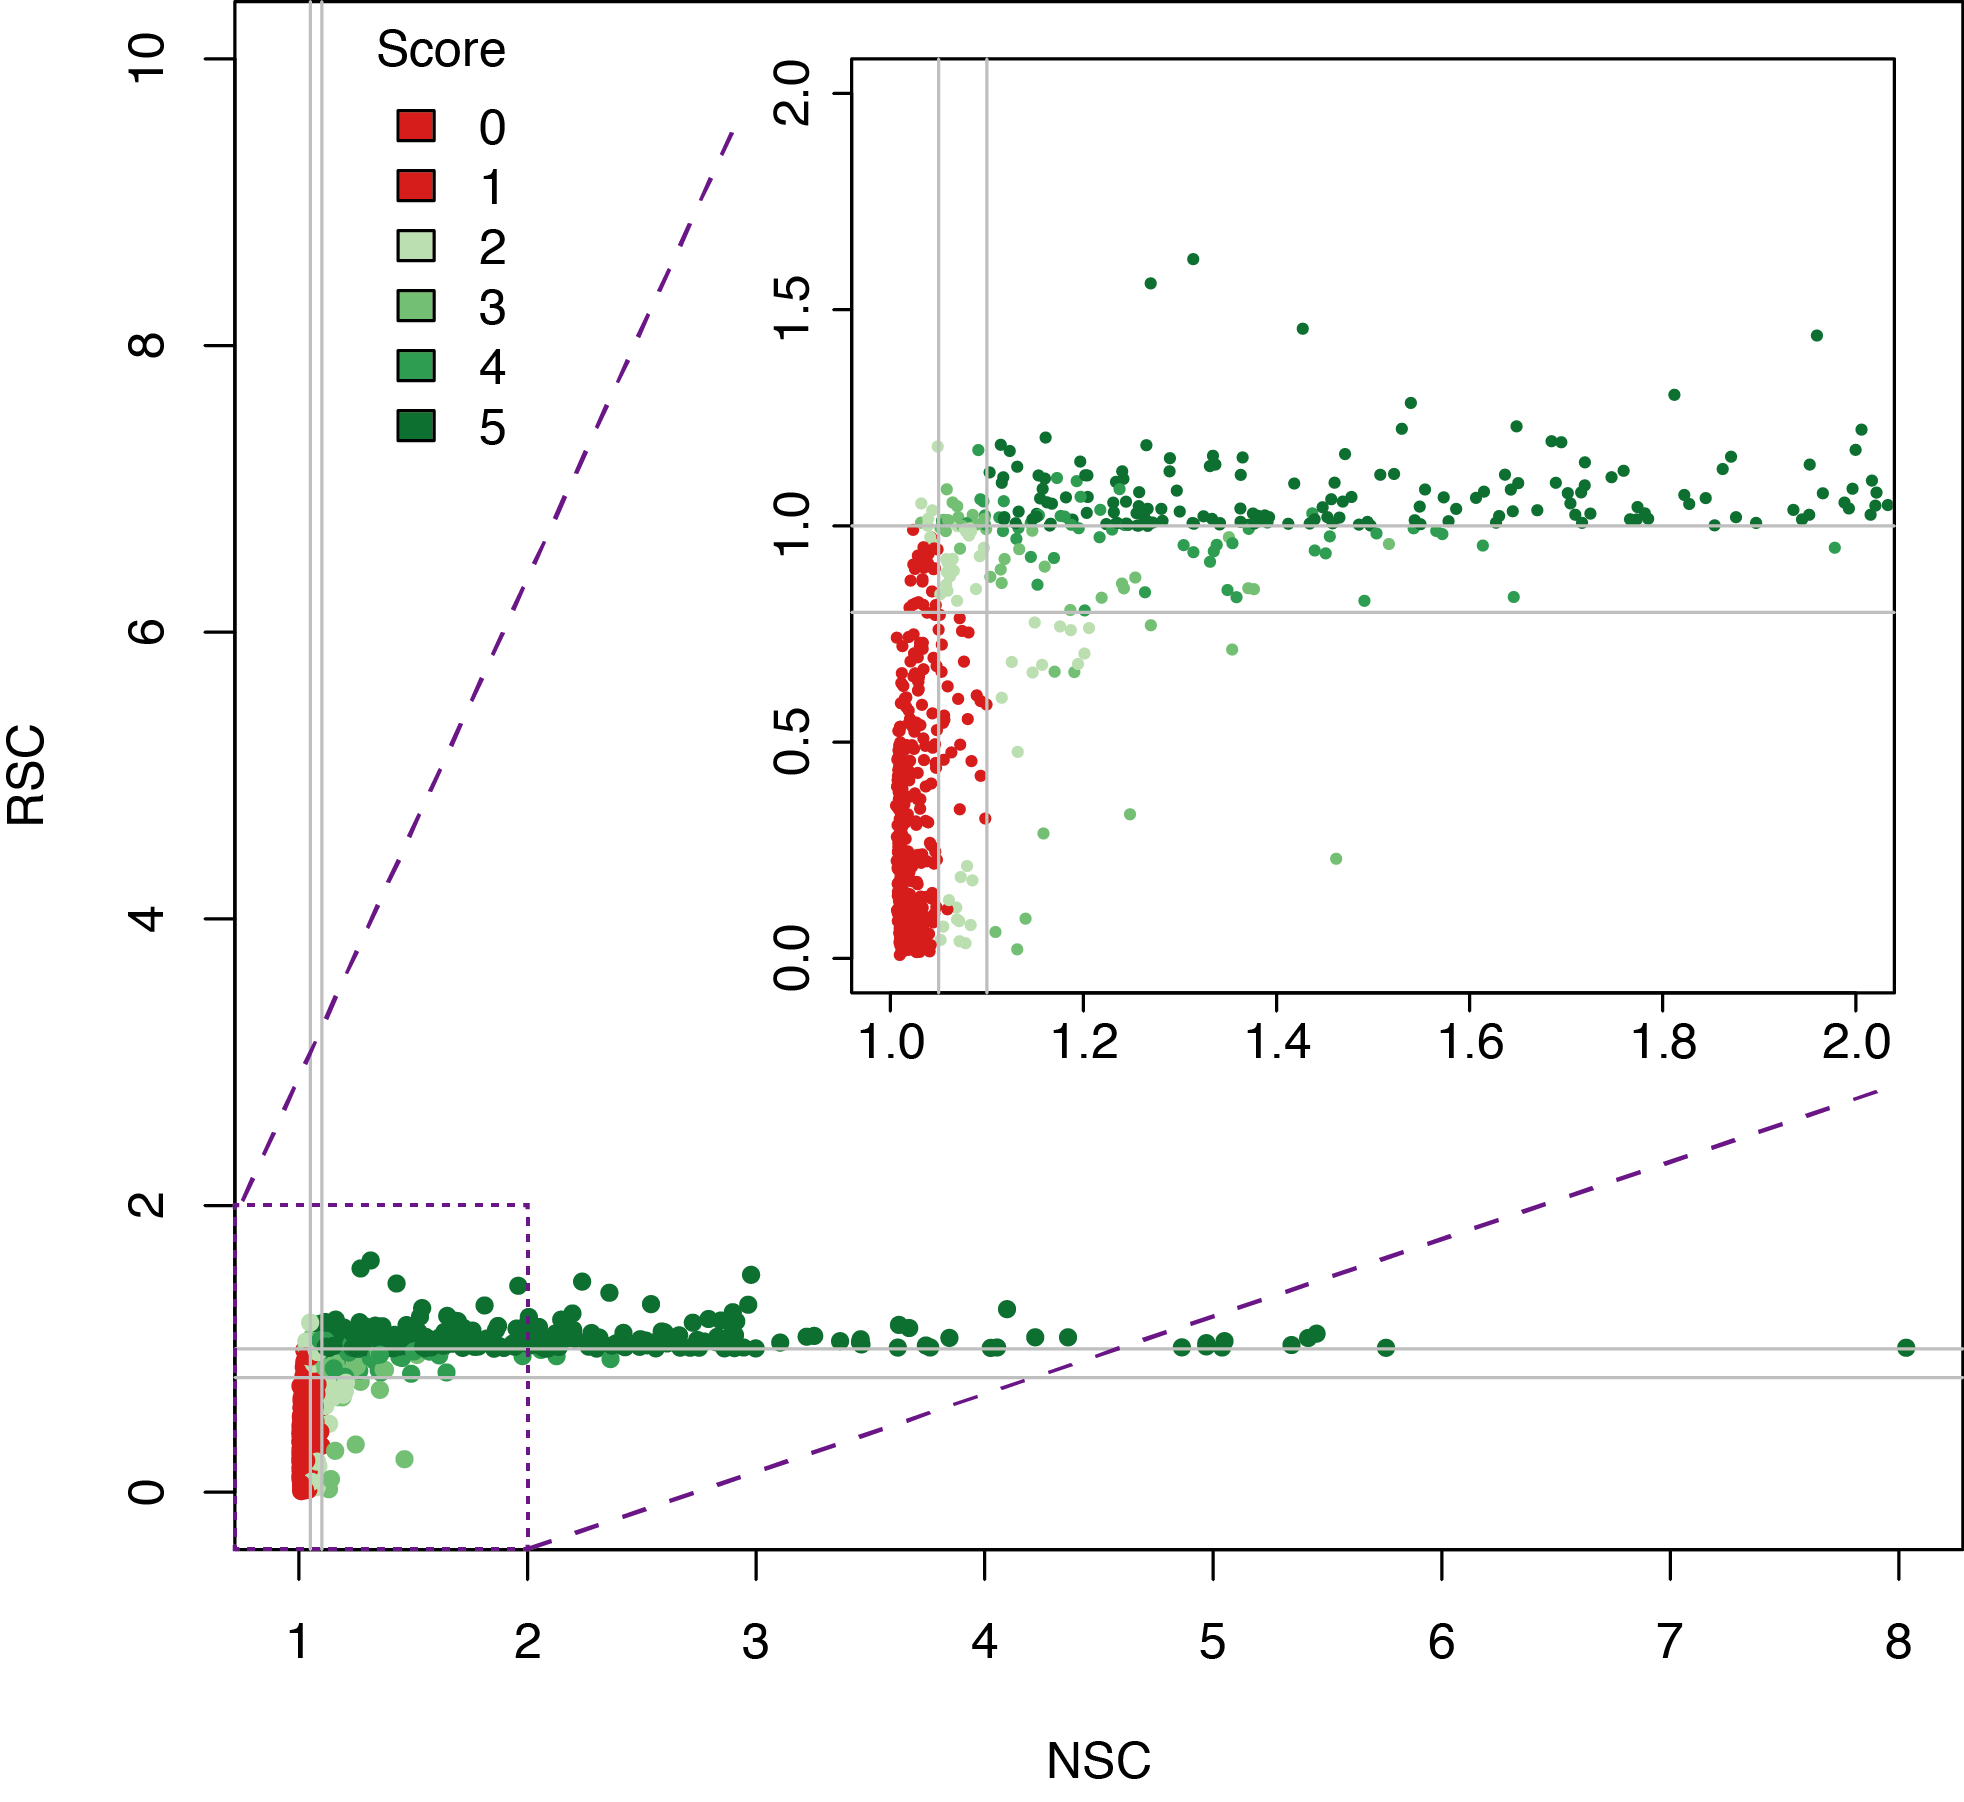
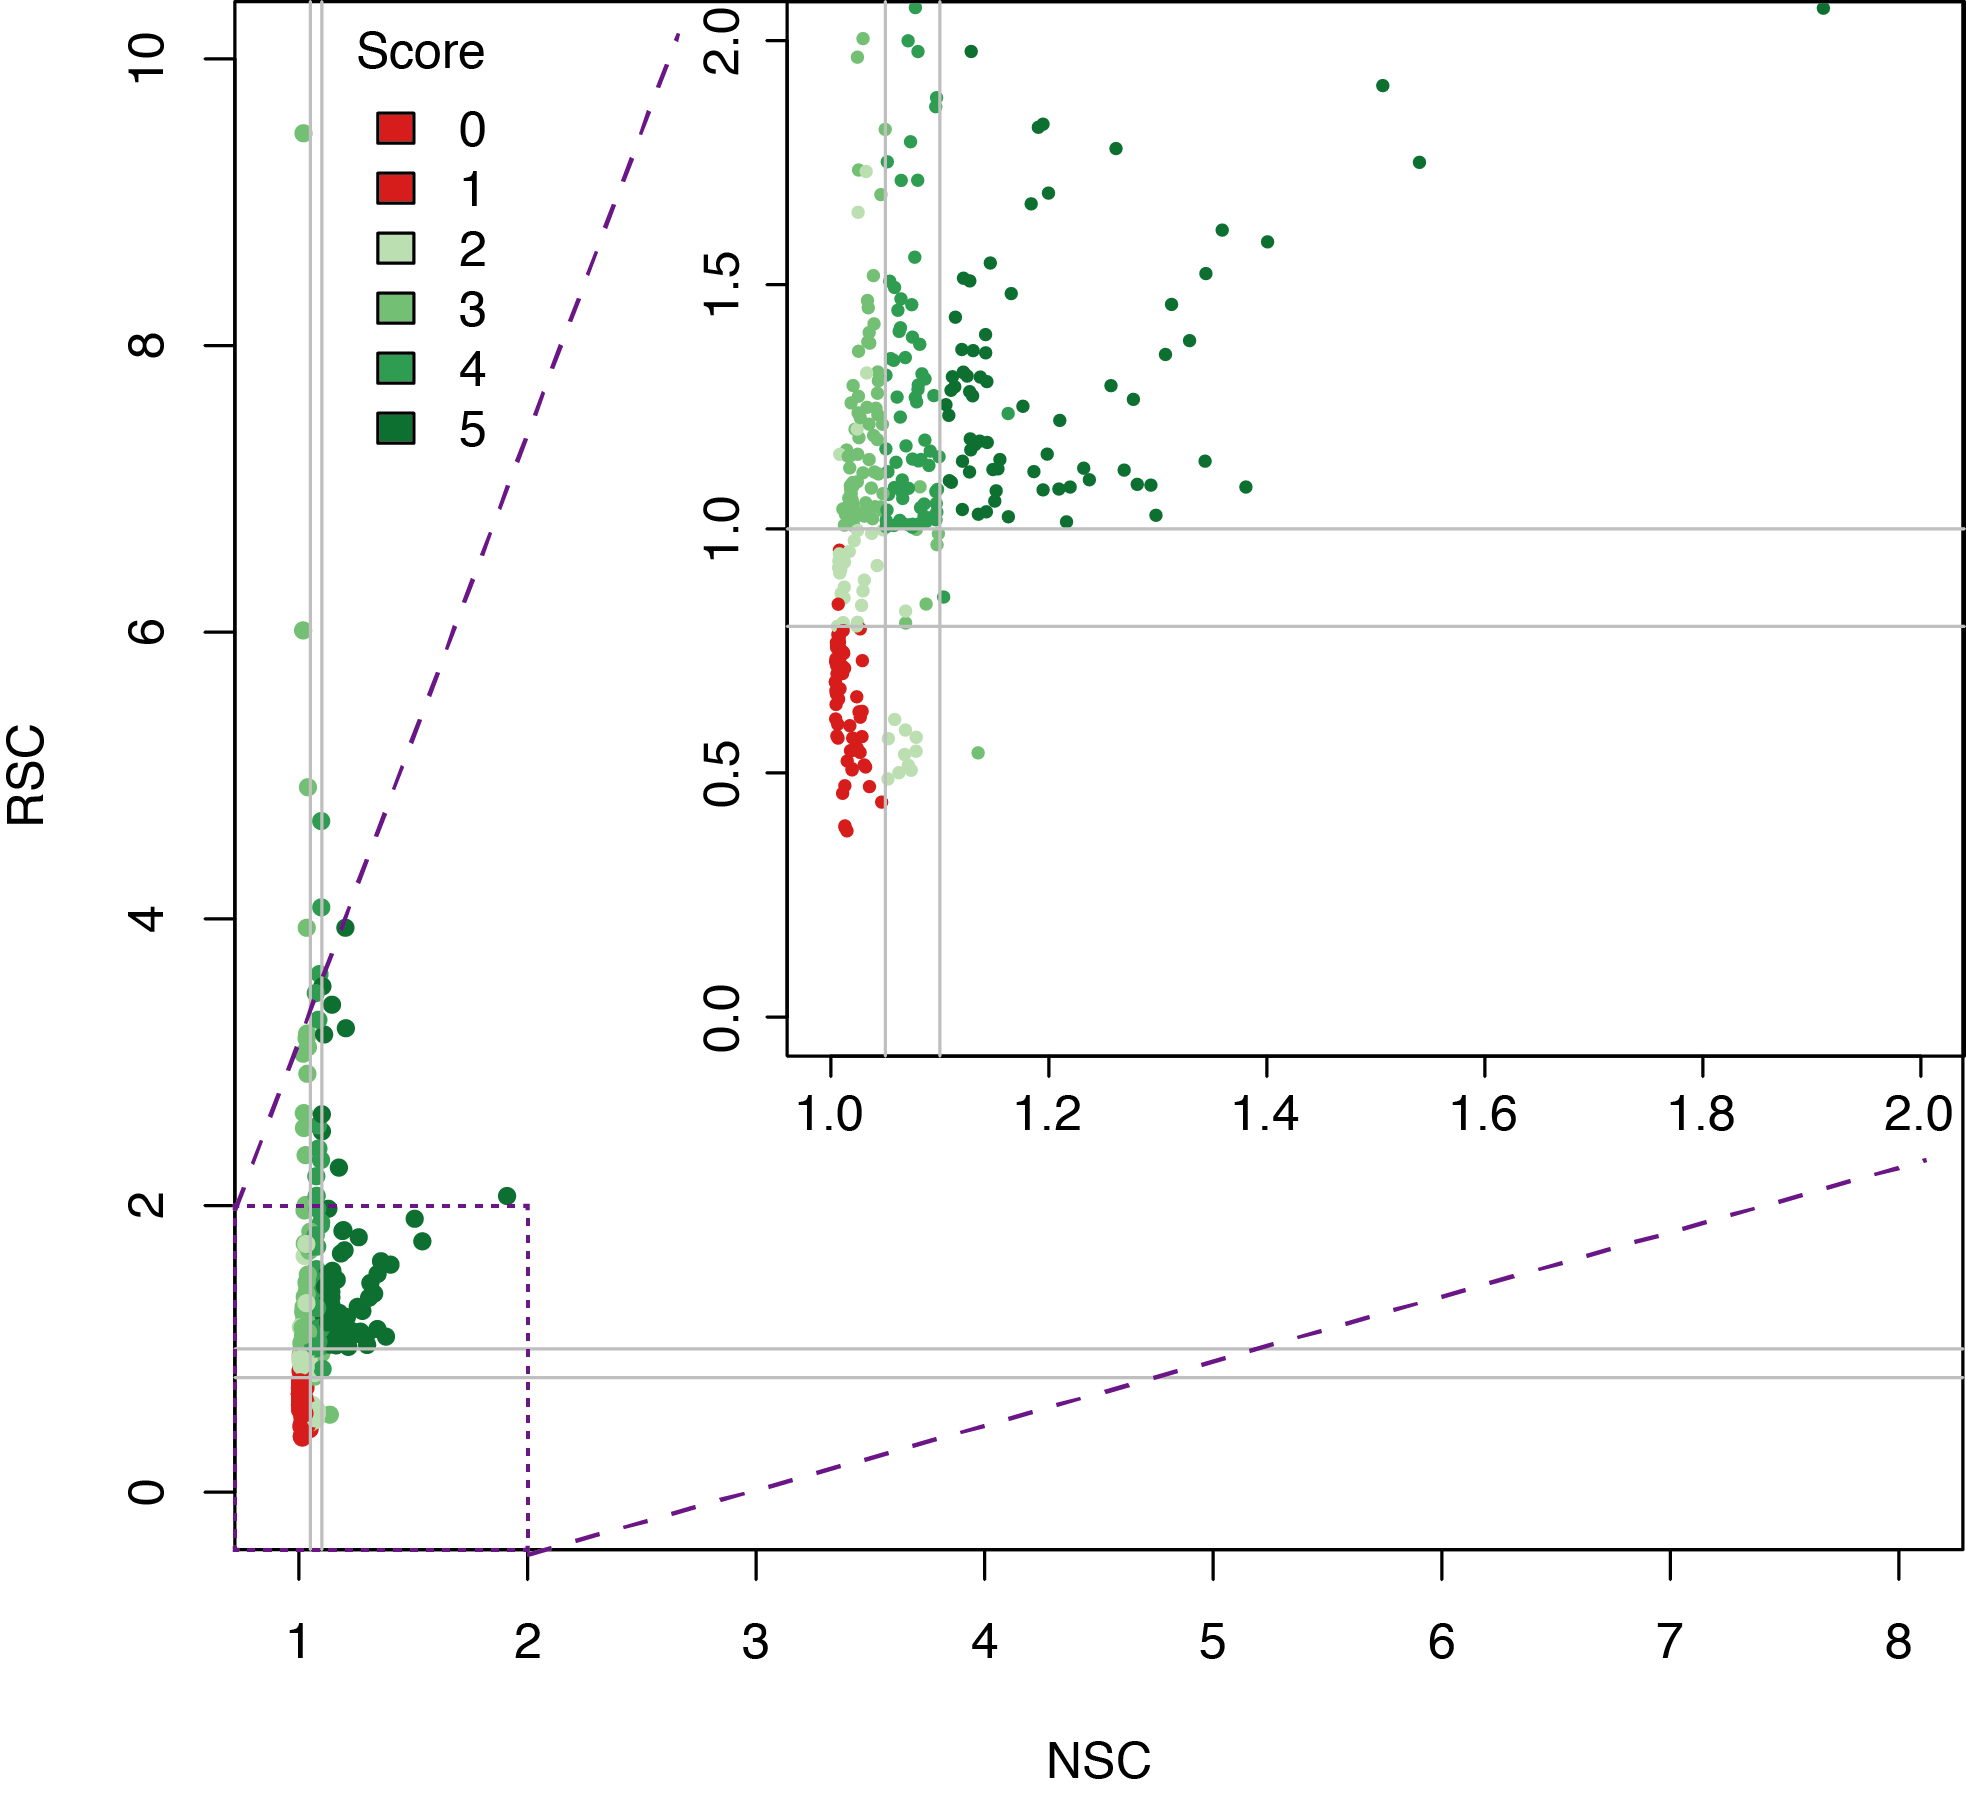
Datasets quality assessment

As not every ChIP-seq datasets are equal in terms of quality, we used four different metrics based on ENCODE ChIP-seq guidelines to retain high quality datasets for downstream analyses. First we used the normalized strand cross-correlation coefficient (NSC) which is a normalized ratio between the fragment-length cross-correlation peak and the background cross-correlation, and the relative strand cross-correlation coefficient (RSC), a ratio between the fragment-length peak and the read-length peak to exclude low quality datasets. We also used the fraction of reads in peaks (FRiP) and the number of peaks identified in each dataset to filter datasets.

Dataset(s) are plotted in a 2D vizualization with NSC and RSC as x- and y-axis, colours highlight the datasets conserved (green) or excluded (red) from the catalogue of binding sites.

In 2022 two sets of filters were added in our QC steps. The first filter consist of removing peaks those length are outside set cutoffs. In Fly we defined the range betwen 50bp and 2kb. For each species the upper cutoff was selected based on the percentage of peaks, we searched the length under for which we have 98% of catalogue, so that we removed peaks above this cutoff. The second filter consist of removing datasets those peaks numbers are greater than two times the number of annotated genes (See Ensembl Plants Arabidopsis thaliana Gene Annotation). As of late 2021, a bit more than 30,000 coding an non-coding genes are identified, giving us a global cutoff of maximum 60,000 peaks per Arabidopsis thaliana ChIP-seq datasets.

Analysing DAP-seq in Thaliana

To provide a comprehensive catalog of transcriptional regulators in Arabidopsis Thaliana, we analysed and incorporated a DNA affinity purification sequencing (DAP-seq) study published by Ecker’s lab (O’Malley R, Cell 2016). This technique was published in Nat. Proctocols in 2017, it is a high-throughput assay that uses in-vitro-expressed TF to interrogate naked gDNA fragments to establish binding locations (peaks).

In short, libraries are constructed using native genomic DNA, which are incubated with an affinity-tagged in vitro expressed TF, and TF-DNA complexes are purified using magnetic separation of the affinity tag.

Annotation of Thaliana transcriptionnal regulators

Function and description of transcriptionnal regulators and histone marks present in this catalogue were retrieved from Ensembl Plants and RefSeq databases. Each transcription regulator was manually curated by using gene names from Ensembl Plants. Ecotype names and experimental conditions were manually curated and homogenized when possible. Transcription regulators are annotated using the AtTFDB "Arabidopsis thaliana transcription factor database" classification allowing users to filter specific TFs based on the characteristics of their DNA-binding domains.

Genomic visualization of peaks and analyses

To perform a de novo motifs analysis for each TF present in our catalogue, we provide a link to the Regulatory Sequence Analysis Tools.

A link to the Ensembl Genome Browser was also added to facilitate genomic integration of the binding sites with other genome annotations. Our BED tracks allow for the visualization of our catalogues of binding sites on the human genome. Finally, different analyses such as the quality of datasets and DNA constraint analysis are provided for each transcription factor.

Downloading peaks

The ReMap BED files are available to download either for a given transcriptional regulator, by Biotype or for the entire catalog as one very large BED file.

For Homo sapiens the GRCh38/hg38 assembly is currently the supported assembly, but we lifted to hg19 with liftover. We provide archives of previous ReMap catalogs.

For Mus musculus we provide BED files for transcriptional regulators. The mm10 assembly is the assembly supported by ReMap, we probide lifted peaks in mm39.

For Drosophila melanogaster we provide BED files for transcriptional regulators. The dm6 assembly is the only assembly supported by ReMap.

For Arabidopsis thaliana we provide BED files for transcriptional regulators, histones marks, ecotypes and biotype coupled with a given ecotype. The TAIR10 assembly is the only assembly supported by ReMap.