Datasets sources

This 4th release of ReMap (2022) present the analysis of a total of 8,103 quality controlled ChIP-seq (n=7,895) and ChIP-exo (n=208) datasets from public sources (GEO, ArrayExpress, ENCODE). Those ChIP-seq/exo datasets have been mapped to the GRCh38/hg38 human assembly. Here we define a “dataset” as a ChIP-seq experiment in a given series (e.g. GSE46237), for a given TF (e.g. NR2C2), in a particular biological condition (i.e. cell line, tissue type, disease state or experimental conditions ; e.g. HELA). Datasets were labeled by concatenating these three pieces of information such as GSE46237.NR2C2.HELA.

Statistics

ChIP-seq

ChIP-exo
Datasets (QC1+2 pass) 7,895 208
Targets 1,002 208
Peaks 181,426,344 990,476

1,210

Transcriptionnal regulators

Search for specific factors

737

Cell lines and tissues

Search for specific cells

8,103

Quality controled ChIP-seq datasets

Browse a given dataset

182,416,820

Binding regions

Download our data

Integration of ChIP-seq and ChIP-exo data

In this ReMap 2022 human release we have manually curated and annotated 10,619 ChIP-seq experiments, retained after quality control 8,103 datasets, and in 2020 one large ChIP-exo experiment (GSE78099) were included from Imbeault M. et al Nature 2017. We applied our pipeline for both type of data, however most postprocessing steps applied by Imbeault M. et al Nature 2017 where applied to the ChIP-exo data. We processed another recent large ChIP-exo experiment (GSE151287, n=1259 datasets, from Lai W.K.M et al bioRxiv 2021) which was however not retained as the peak numbers identified after QCs were inconsistent with the publication.

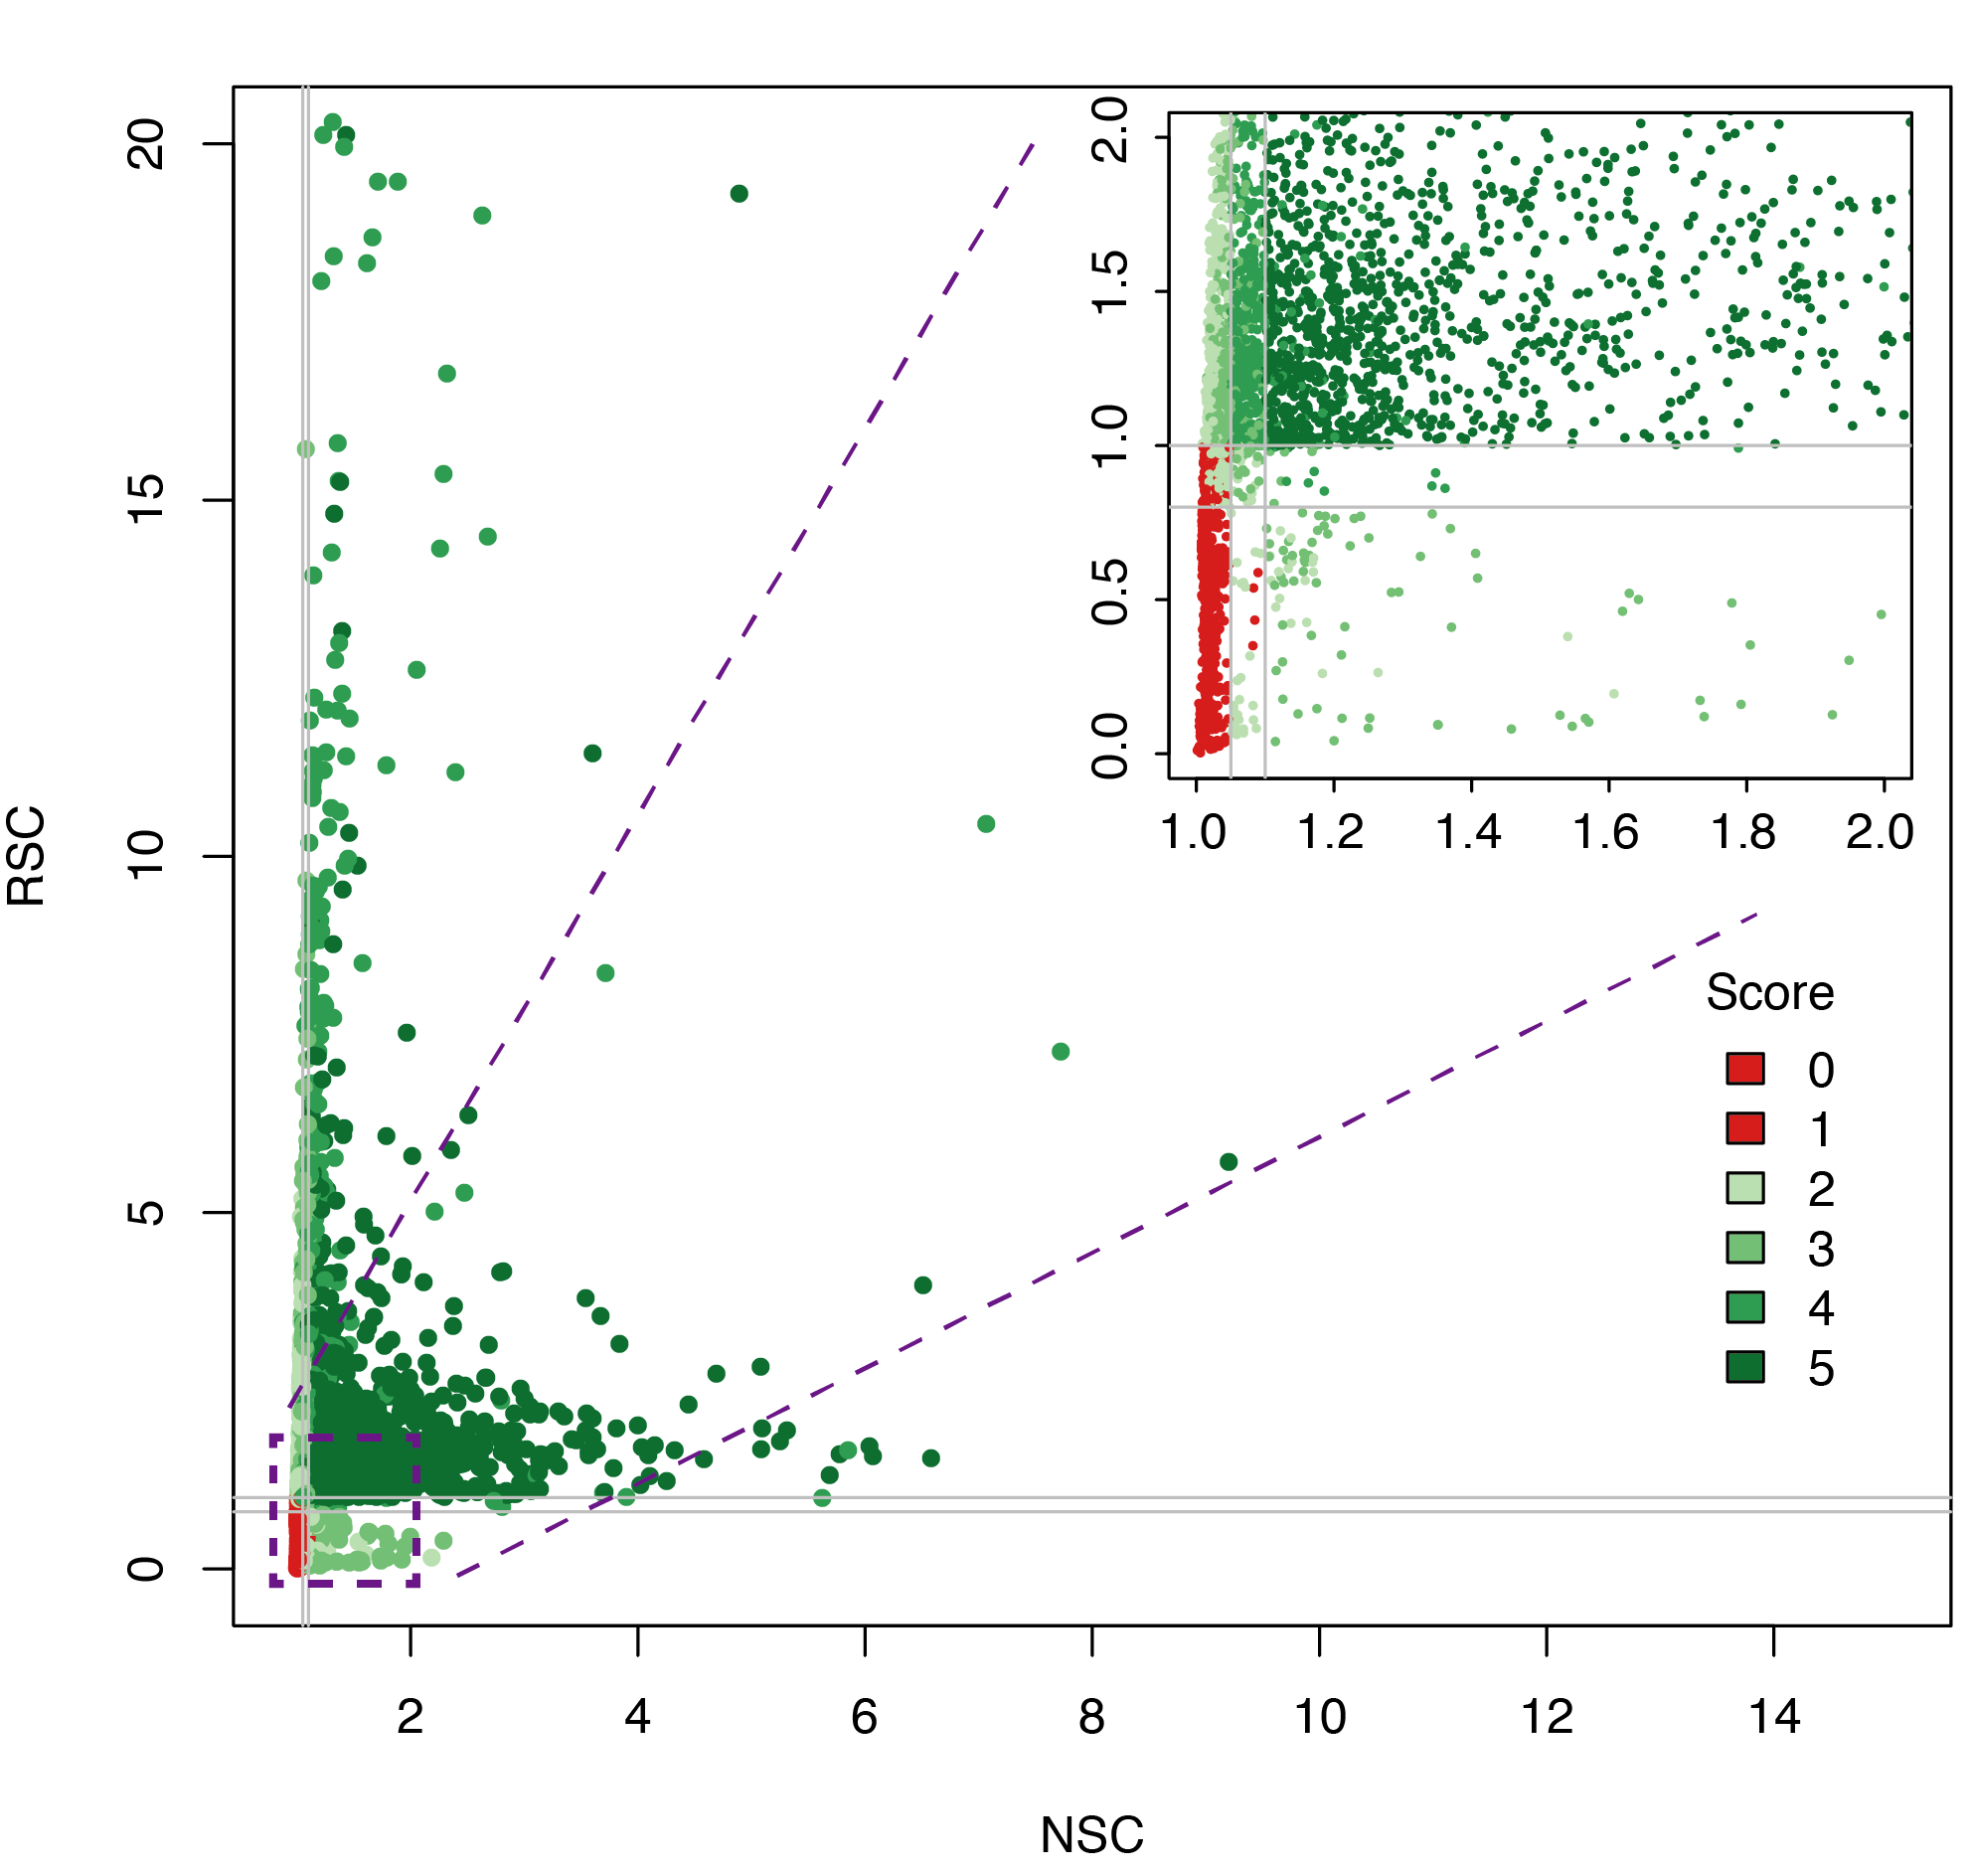
After consistent peak calling and stringent QCs, we identified a total of 182 million peaks bound by transcriptionnal regulators (including 990,476 peaks from ChIP-exo). These numbers include overlapping sites for identical TRs which were studied in various conditions. To address this we merged overlapping TR peaks for similar TR obtaining a catalog of XX million non-redundant peaks.

Datasets quality assessment

As not every ChIP-seq datasets are equal in terms of quality, we used four different metrics based on ENCODE ChIP-seq guidelines to retain high quality datasets for downstream analyses. First we used the normalized strand cross-correlation coefficient (NSC) which is a normalized ratio between the fragment-length cross-correlation peak and the background cross-correlation, and the relative strand cross-correlation coefficient (RSC), a ratio between the fragment-length peak and the read-length peak to exclude low quality datasets. We also used the fraction of reads in peaks (FRiP) and the number of peaks identified in each dataset to filter datasets.

Dataset(s) are plotted in a 2D vizualization with NSC and RSC as x- and y-axis, colours highlight the datasets conserved (green) or excluded (red) from the catalogue of binding sites.

In 2022 two sets of filters were added in our QC steps. The first filter consist of removing peaks those length are outside set cutoffs. In Human we defined the range betwen 50bp and 1.5kb. For each species the upper cutoff was selected based on the percentage of peaks, we searched the length under for which we have 98% of catalogue, so that we removed peaks above this cutoff. The second filter consist of removing datasets those peaks numbers are greater than two times the number of annotated genes (See Ensembl Human gene annotation statistics). As of late 2021, about 40,000 coding an non-coding genes are identified, giving us a cutoff of maximum 80,000 peaks per datasets.

Datasets quality plot

Human

ChIP-exo post-processing

For the ChIP-exo data we applied three post-processing steps as described in Imbeault M. et al Nature 2017 material and methods. In brief, we filtered out peaks that would meet any of these criteria: MACS score <80 (equivalent to a P = 1 × 10−8); ratio of forward versus reverse strand reads greater than 4; fewer than 20 reads over 500 bp per 15 million reads; normalized read count was less than twofold over the control. The large ChIP-exo experiment (GSE151287, n=1259 datasets) from Lai W.K.M et al bioRxiv 2021 were not retained as the peak numbers identified after QCs were inconsistent with the publication.

Annotation and classification of transcription factors

Function and description of transcriptionnal regulators present in this catalog (GEO, ArrayExpess, ENCODE) were retrieved from HGNC, Ensembl and RefSeq databases. When possible each transcription factor was also annotated using the classification of human transcription factors allowing users to filter specific TFs based on the characteristics of their DNA-binding domains.

Genomic visualization of peaks and analyses

To perform a de novo motifs analysis for each TF present in our catalogue, we provide a link to the Regulatory Sequence Analysis Tools.

A link to the UCSC Genome Browser was also added to facilitate genomic integration of the binding sites with other genome annotations. Our BED tracks allow for the visualization of our catalogues of binding sites on the human genome. Finally, different analyses such as the quality of datasets and DNA constraint analysis are provided for each transcription factor.

Downloading peaks

The ReMap BED files are available to download either for a given transcriptional regulator, by Biotype or for the entire catalog as one very large BED file.

For Homo sapiens the GRCh38/hg38 assembly is currently the supported assembly, but we lifted to hg19 with liftover. We provide archives of previous ReMap catalogs.

For Mus musculus we provide BED files for transcriptional regulators. The mm10 assembly is the assembly supported by ReMap, we probide lifted peaks in mm39.

For Drosophila melanogaster we provide BED files for transcriptional regulators. The dm6 assembly is the only assembly supported by ReMap.

For Arabidopsis thaliana we provide BED files for transcriptional regulators, histones marks, ecotypes and biotype coupled with a given ecotype. The TAIR10 assembly is the only assembly supported by ReMap.